 // Gig Dossier
Flood Project
// Brief
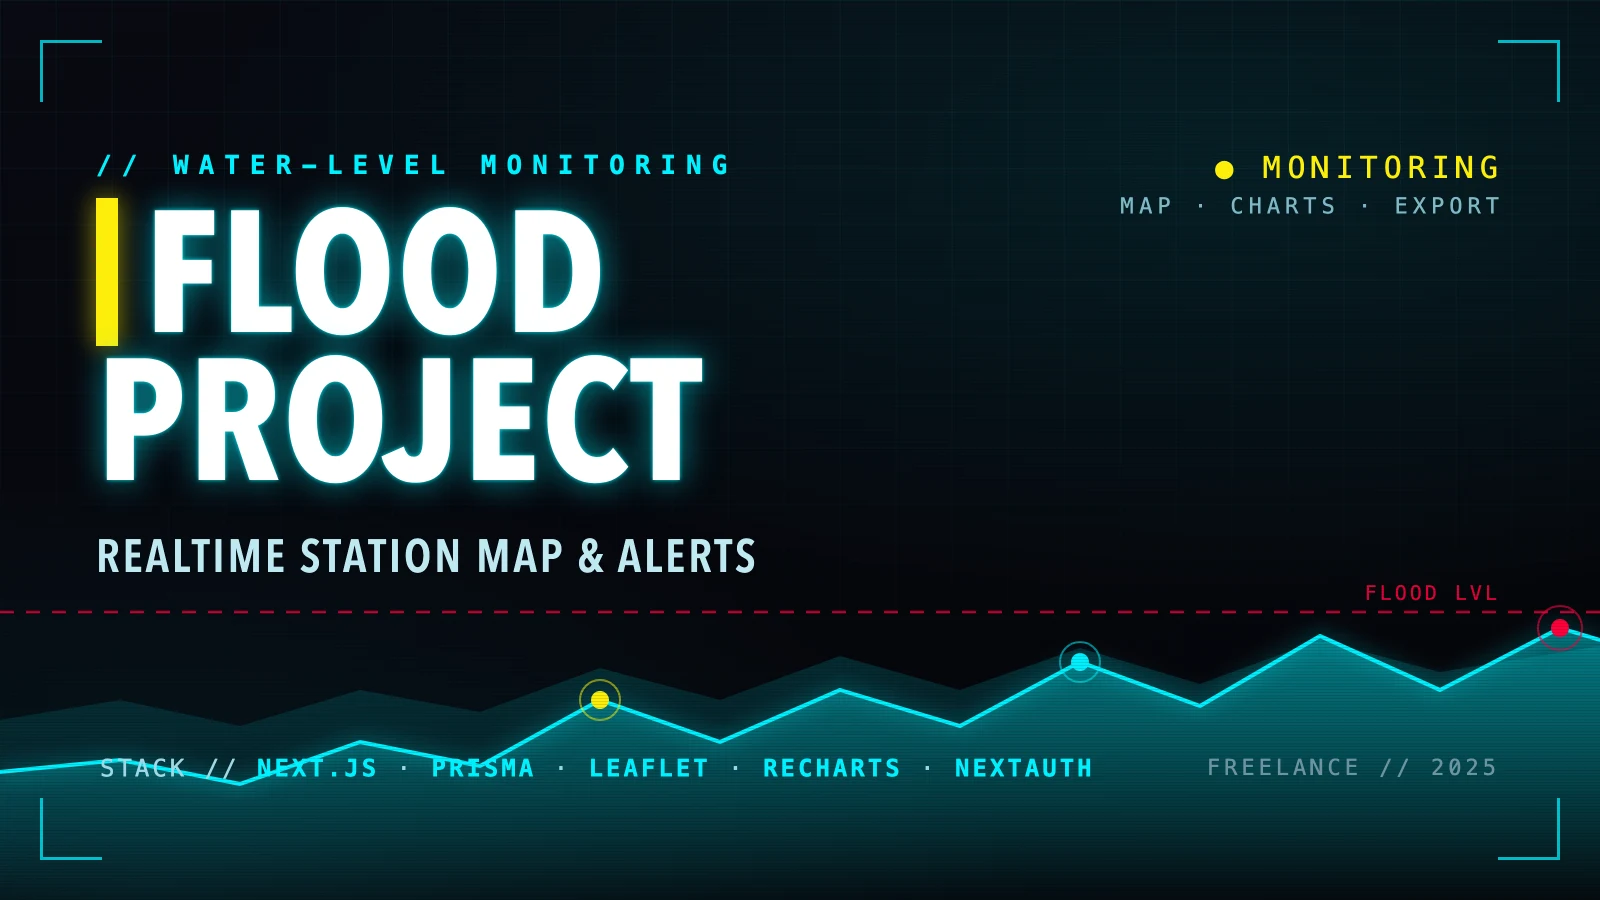
A flood and water-level monitoring dashboard for tracking station gauges in real time. Field stations plot on an interactive, marker-clustered Leaflet map; each streams its current water level with historical area/line charts (Recharts) read against a flood threshold, and operators can export readings to CSV. Ships a full account system with role-based user management and an admin dashboard. Built with Next.js 15 (App Router, Turbopack), React 19, and TypeScript on a Prisma data layer, with Tailwind + shadcn/ui, react-hook-form + Zod forms, and NextAuth (bcrypt) auth. Delivered as a focused freelance build.
// Timeline
History — water-level history & schema finalize
NowFeb 2025
Added the historical water-level view and finalized the data schema.
Operators — user management & UX polish
Feb 2025
Added role-based user management for operators and a round of UX/UI refinement.
Charts & export — area charts + CSV
Feb 2025
Reworked the readings API and swapped line charts for area charts (Recharts), added CSV export, and shipped the operator dashboard with toasts.
Stations — Leaflet map & data schema
Feb 2025
Built the interactive station map with marker clustering, modelled the readings in Prisma, and surfaced live water levels.
Auth — Accounts & role-based access
Feb 2025
Added a NextAuth account system with bcrypt-hashed credentials and react-hook-form + Zod validated sign-in.
Kickoff — Next.js scaffold & shell
Feb 2025
Set up the project on Next.js with Tailwind, a global theme, and the app navigation shell.
Written About
2// Open for freelance
Need something like this built?
Remote web app work, scoped and shipped end to end — start with a message on Fastwork.